The open field is a test used for measuring locomotor activity and anxiety-like behavior in laboratory rodents. It is a square-shaped arena enclosed by walls on all sides. Rodents typically prefer to spend time in enclosed spaces and will therefore spend more time exploring the periphery of the open field versus the center. The duration of time spent exploring the center of the open field, as well as the latency to first venture into the center, are two measures used to approximate the relative level of anxiety expressed by individuals. Total distance traveled, ambulatory versus resting time, and average velocity are measures used to describe locomotor activity.
Because the measures of anxiety in the open field test are activity-dependent, it is important to always check that experimental groups have similar locomotor activity levels (or normalize for activity level) before making any conclusions about anxiety. It is also noteworthy that rodents tend to habituate to the novelty of the open field test over time. Over the course of a 5 or 10 minute test, you may notice your subjects spending more time in the center of the open field or decreasing their overall activity level. BehaviorCloud makes it easy to use the open field for evaluating activity and anxiety levels in rodents by automatically tracking the subject’s position and extracting all of the relevant variables described above. BehaviorCloud also allows you to analyze your data in time bins, so you can evaluate any habituation effect that may occur.
Materials:
- Open field
- Mobile device (iOS or Android) with the BehaviorCloud Camera app installed
- Tripod or mobile device mount
- WiFi
- Laptop or second mobile device
- Calibration pattern from app.behaviorcloud.com
Procedure:
Setting up the testing room
Environment: The testing room should be a quiet space with WiFi access. Depending on the objective of a particular experiment, testing can be performed during day or night and the room can be illuminated with dim white light or red light. The maze should be set up several feet from where the experimenter sits.
Streaming: Log in to the BehaviorCloud Camera app and begin streaming. Mount the mobile device running the BehaviorCloud Camera app above the open field so the entire arena is in full view. It is important for the mobile device and the open field to remain in the same positions throughout testing. The position of the arena can be marked out on the floor in case of accidental bumping during the experiment.
Controls: A laptop or a second mobile device should be set up where the experimenter plans to sit during trials. Log in to app.behaviorcloud.com to reach the experiment dashboard and create a new experiment.
Running a trial
Preparation: Mice should be brought into the testing room approximately 30 minutes before testing to acclimate to the environment.
Calibration: To get an accurate measure of distance traveled by each rodent, it is important to calibrate the system at the beginning of an experiment. From the laptop or second mobile device, click calibration and place the checkerboard calibration pattern into the arena in full view. A preview window will show the system automatically recognize the pattern and calculate a distance measurement. Click the arrow to continue to the next step.
Starting a trial: Click Experiment Video and then the plus icon to add a new subject. Select the mobile device that is being used for streaming, enter the subject ID, and enter the duration of the test in seconds. On the next screen, you will be prompted to clear the arena, which means to remove any animals, people, or other moving objects from the view. Then you will be prompted to insert the subject and begin the trial.
Tip: Each animal should be started in the same position for consistency - we recommend starting in a corner of the arena.
Finishing a trial: When the scheduled duration has elapsed, the test will automatically end and you will be prompted to enter the next subject ID. Repeat running subjects until you are finished.
Analyzing data
BehaviorCloud makes your raw video data and analysis tools accessible from anywhere using your online account. At your desk in the lab (or at your favorite coffee shop), log in to your account and run your analysis.
Setting the boundary: Set a tracking boundary to specify the area to be analyzed. Click save.
Generate position data: Next generate XY position data for all of the subjects.
Set zones: Draw a zone to specify the entire arena and label it “Total”, then draw an overlapping zone to specify the center of the arena and label it as “Center”. Different labs have used different sized center zones in the literature, but we recommend drawing a square that is approximately one half the size of the total arena, leaving a quarter length around each side. BehaviorCloud will automatically apply the same zone to all of your subjects for consistency. Click save.
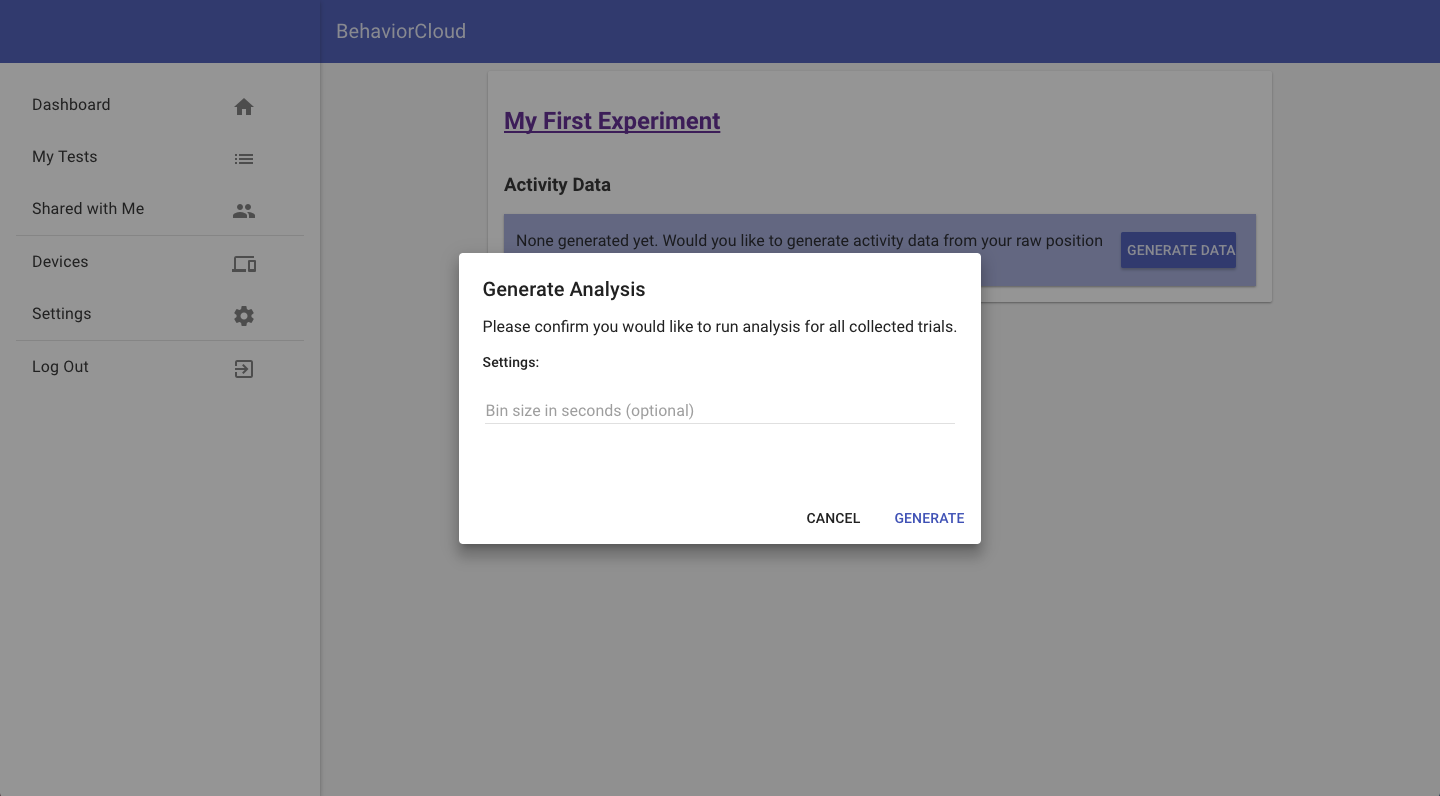
Generate data files: Generate zoned activity data for all of the subjects and download the .csv file to get distance traveled, time spent in each zone, latency to enter the center zone, and more. Subtract center time and distance from the total time and distance if you are interested in these measures for the periphery. When generating data for all subjects, you will be given the option to define time bins if you choose.
Interpreting data
Mice that spend more time in the center of the arena and have a shorter latency to first enter the center are generally considered to have a lower anxiety-like response. As in all behavioral tests, you can expect considerable inter-individual variation, which makes it important to design experiments from the beginning with an appropriate number of subjects. You can easily examine the path that each animal traveled using the plots included in the Raw Position Data section of your Experiment dashboard.

Thanks for reading! Check out our previous blog post on visualizing data to learn how to present your results from the open field test as activity traces, tracked videos, or heat maps.