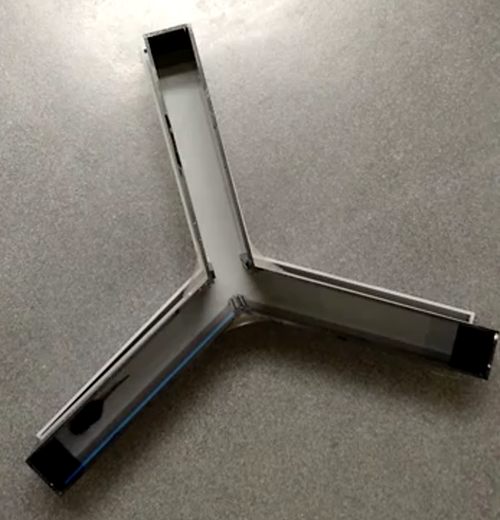
The Y maze (or similarly, T maze) is a test used for measuring working memory in laboratory rodents. It is a Y-shaped (or T-shaped) maze with three arms enclosed by walls on all sides. Rodents typically prefer to explore a new part of the maze rather than the part they most recently visited, thus alternating investigating each of the three arms. The sequence of arm entries is recorded to determine how often the animal successively chose to visit three different arms out of the total number of opportunities it had to alternate. The Y maze can be used to assess cognitive deficits in laboratory rodents.
Materials:
- Y maze
- Mobile device (iOS or Android) with the BehaviorCloud Camera app installed
- Tripod or mobile device mount
- WiFi
- Laptop or second mobile device
- Calibration pattern from app.behaviorcloud.com
Procedure:
Setting up the testing room
Environment: The testing room should be a quiet space with WiFi access. Depending on the objective of a particular experiment, testing can be performed during day or night and the room can be illuminated with dim white light or red light. The maze should be set up several feet from where the experimenter sits.
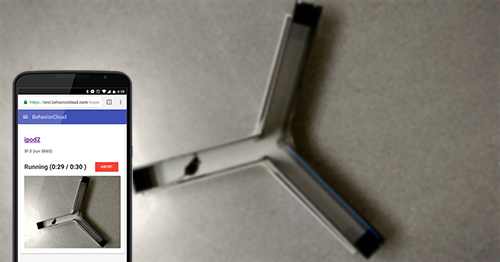
Streaming: Log in to the BehaviorCloud Camera app and begin streaming. Mount the mobile device running the BehaviorCloud Camera app above the maze so the entire area is in full view. It is important for the mobile device and the maze to remain in the same positions throughout testing. The position of the arena can be marked out on the floor in case of accidental bumping during the experiment.
Controls: A laptop or a second mobile device should be set up where the experimenter plans to sit during trials. Log in to app.behaviorcloud.com to reach the experiment dashboard and create a new experiment.
Running a trial
Preparation: Mice should be brought into the testing room approximately 30 minutes before testing to acclimate to the environment.
Calibration: To get an accurate measure of distance traveled by each rodent, it is important to calibrate the system at the beginning of an experiment. From the laptop or second mobile device, click calibration and place the checkerboard calibration pattern into the arena in full view. A preview window will show the system automatically recognize the pattern and calculate a distance measurement. Click the arrow to continue to the next step.
Starting a trial: Click Experiment Video and then the plus icon to add a new subject. Select the mobile device that is being used for streaming, enter the subject ID, and enter the duration of the test in seconds. On the next screen, you will be prompted to clear the arena, which means to remove any animals, people, or other moving objects from the view. Then you will be prompted to insert the subject and begin the trial.
Tip: Each animal should be started in the same position for consistency - we recommend starting in the center of the Y maze.
Finishing a trial: When the scheduled duration has elapsed, the test will automatically end and you will be prompted to enter the next subject ID. Repeat running subjects until you are finished.
Analyzing data
BehaviorCloud makes your raw video data and analysis tools accessible from anywhere using your online account. At your desk in the lab (or at your favorite coffee shop), log in to your account and run your analysis.
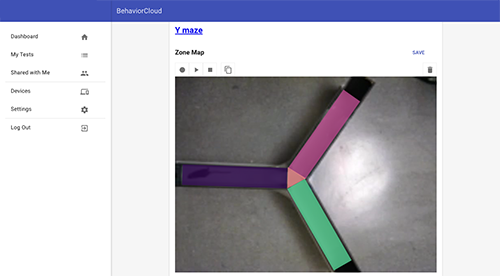
Setting the boundary: Set a tracking boundary to specify the area to be analyzed. Click save.
Generate position data: Next generate XY position data for all of the subjects.
Set zones: Draw and label zones to specify each of the three arms. Click save.
Generate data files: Generate zone sequence data for all of the subjects and download the .csv file to get the raw sequence of zone entries. Also, generate spontaneous alternation data and download the .csv file to have BehaviorCloud automatically calculate spontaneous alternation.
Interpreting data
Mice that have a higher score for alternation do a better job of varying their visits to different arms of the maze based on recency. A lower score for alternation could point to cognitive deficits. As in all behavioral tests, you can expect considerable inter-individual variation, which makes it important to design experiments with an appropriate number of subjects. You can easily examine the path that each animal traveled using the plots included in the Raw Position Data section of your Experiment dashboard.
While you’re working on the Y maze, don’t forget that BehaviorCloud makes it easy to invite collaborators to view or contribute to experiments. Just click the menu next to an experiment to manage sharing and invite collaborators. Happy testing!